Discover Sharlife's Crypto Screener

Trading signal screeners simplify the process by analyzing data and providing buy or sell alerts, making them invaluable for traders. Sharlife offers specialized trading signals for cryptocurrency lovers, helping them navigate the volatile market and capitalize on opportunities to enhance their strategies.
Before diving into trading signals, it's essential to understand the fundamental technical concepts that are key to achieving success in trading. This understanding is particularly important in the cryptocurrency market, where volatility poses significant risks.
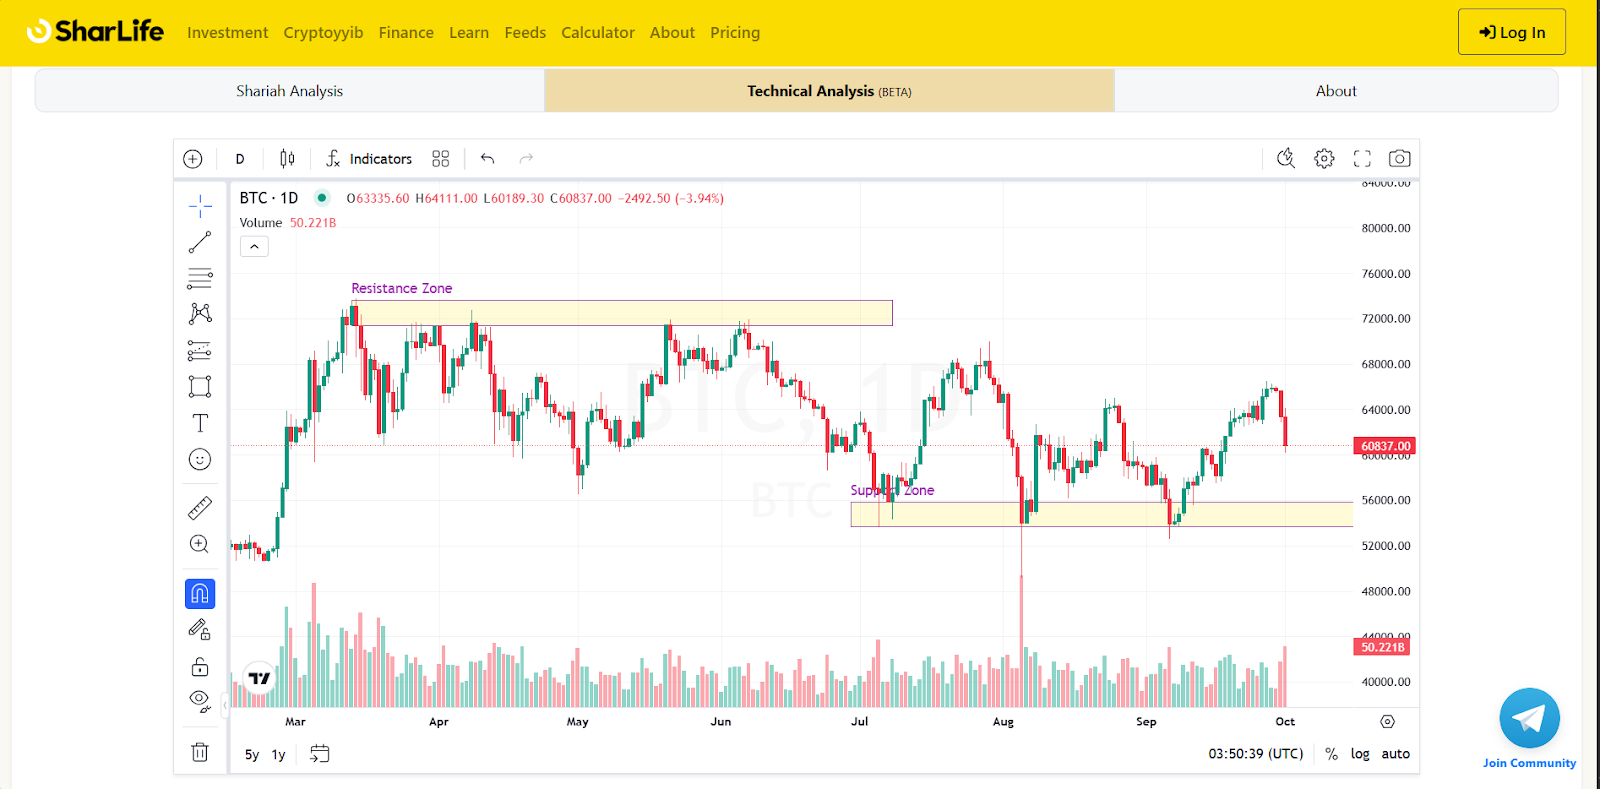
Support and Resistance
Support and resistance are key concepts in trading that help identify potential price levels where the market may pause or reverse.
Support occurs when demand exceeds supply, causing prices to stabilize or rise, especially during a downtrend. This is where buyers are more likely to step in, creating a desire to purchase at a specific price level.
On the other hand, resistance happens when supply exceeds demand, leading to price stabilization or decline, particularly in an uptrend. Here, sellers are more inclined to sell, creating a desire to do so at a certain price point.
Traders identify key levels by looking at past price pauses and watching if prices stop or reverse near those points. Experienced traders often use these past support and resistance levels to predict future moves, but technical analysis isn't always precise. Prices can break through or reverse early, so flexibility is key, which is why these levels are often called "zones."
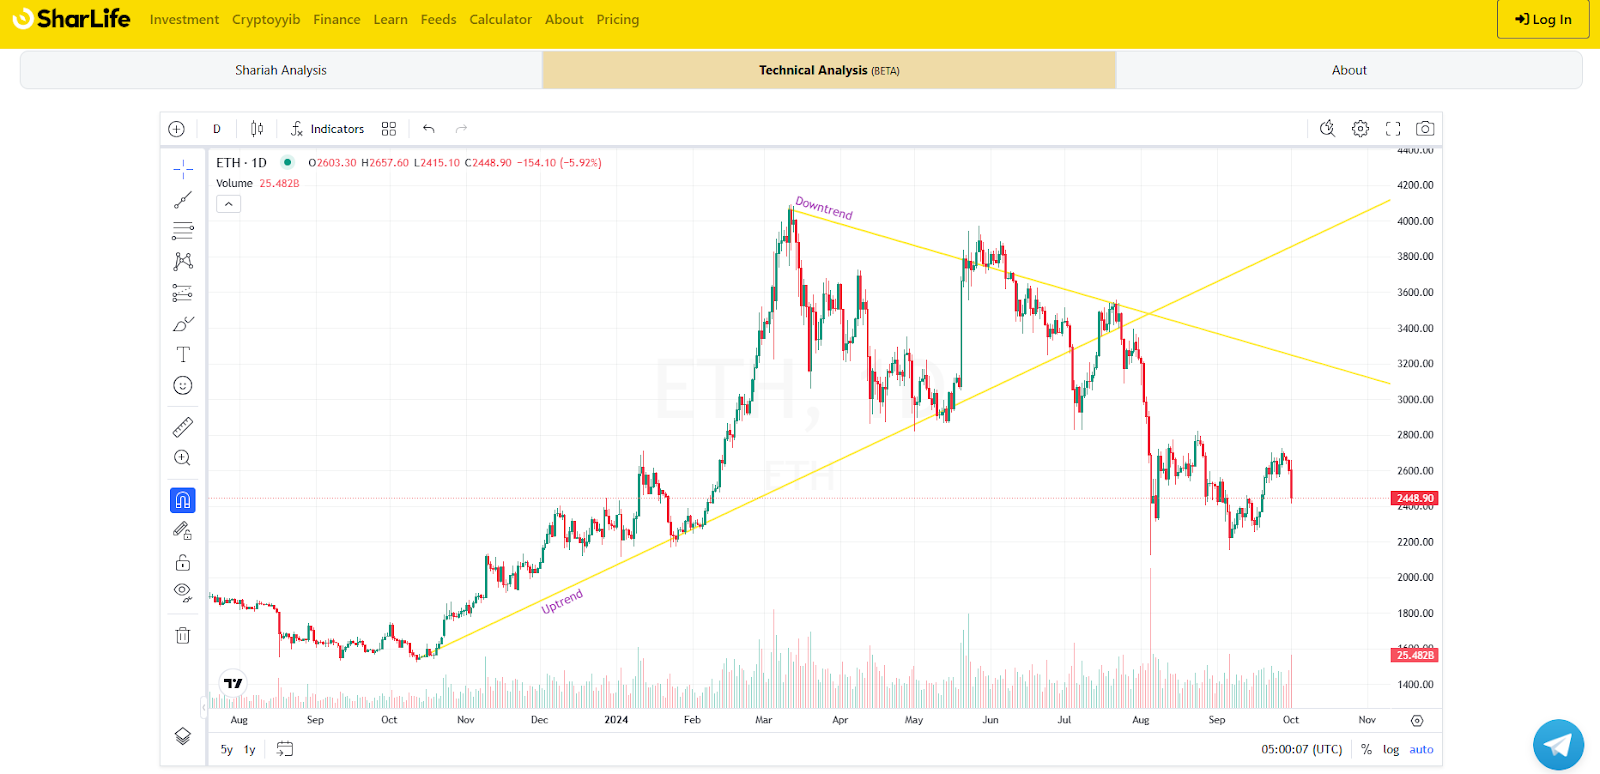
Trend
A trendline is a straight line drawn on a price chart that helps to identify the direction of a market. It connects significant price points, showing whether the market is moving upward, downward, or sideways. Traders use trendlines along with price action and various technical indicators to analyze trends and make informed decisions. By observing these lines, traders can better understand market momentum and potential future price movements.
Uptrend
An uptrend is characterized by an overall increase in price, indicating a bullish market where traders feel confident to buy. This upward movement reflects growing demand and positive sentiment among investors.
Downtrend
In contrast, a downtrend is the opposite of an uptrend, marked by a decline in prices. During a downtrend, market sentiment is generally negative, leading to increased selling pressure and a lack of confidence among buyers. Understanding these trends helps traders make informed decisions about when to enter or exit the market.
While trendlines effectively indicate the overall direction of a market, they often require adjustments as price movements change. For instance, during an uptrend, the price might dip below the trendline, but this doesn’t automatically signal the end of the trend.
The price can fall below the trendline and then resume its upward trend suddenly. In such cases, it’s important to redraw the trendline to accurately reflect the new price action and maintain an accurate representation of the trend. This flexibility ensures that traders have a clear understanding of market dynamics.
Volume in crypto
In cryptocurrency markets, volume refers to the total number of units traded during a specific period, making it a crucial factor for traders. Higher daily volume indicates greater liquidity, meaning assets can be bought or sold more easily.
The volume also helps gauge the significance of market movements—the higher the volume during a price change, the more meaningful that move is likely to be. For example, on a given day, if five trades occur and each trade involves 100 units, the total volume for the day would be 500 units.
In summary, there are many technical concepts but these 3 which are, support and resistance, trend, and volume are very essential technical concepts in cryptocurrency trading. Together, they help traders identify key market levels, assess overall direction, and evaluate the significance of price movements. Understanding and applying these tools can enhance a trader's ability to make informed decisions and respond to market shifts effectively.
Sharlife Trading Signal Screeners
Now that we've covered some technical concepts, let's move on to the Sharlife Trading Signal Screeners. What exactly are they, and how can you access them? We’ll explain everything here.
What Are They?
Sharlife Trading Signals provide insights based on a range of technical indicators and strategies. These signals help traders identify potential entry and exit points for specific cryptocurrencies, making them valuable tools for both beginners and experienced traders.
Accessing Sharlife Signals:
Free Access:
Users can access basic trading signals for free without a subscription to Sharlife for top 10 tokens like Bitcoin, Ethereum, Solana, and others.
Subscription:
For more specific token requests, users can subscribe to Sharlife. Check out their pricing page to find a plan that fits your needs.
Sharlife's trading signal offers various screeners for traders to find the best entry and exit strategy. These are the 42 screeners that Sharlife offers:
|
|
|
For more information, follow this link and stay tuned for upcoming articles on specific signals and indicators. https://sharlife.my/crypto-shariah#trading-signal